More to the point: Flow charts say more than a thousand words.
Building Cybernetics visualizes and reports on the energy flows you can’t see: Avelon Energy Management.
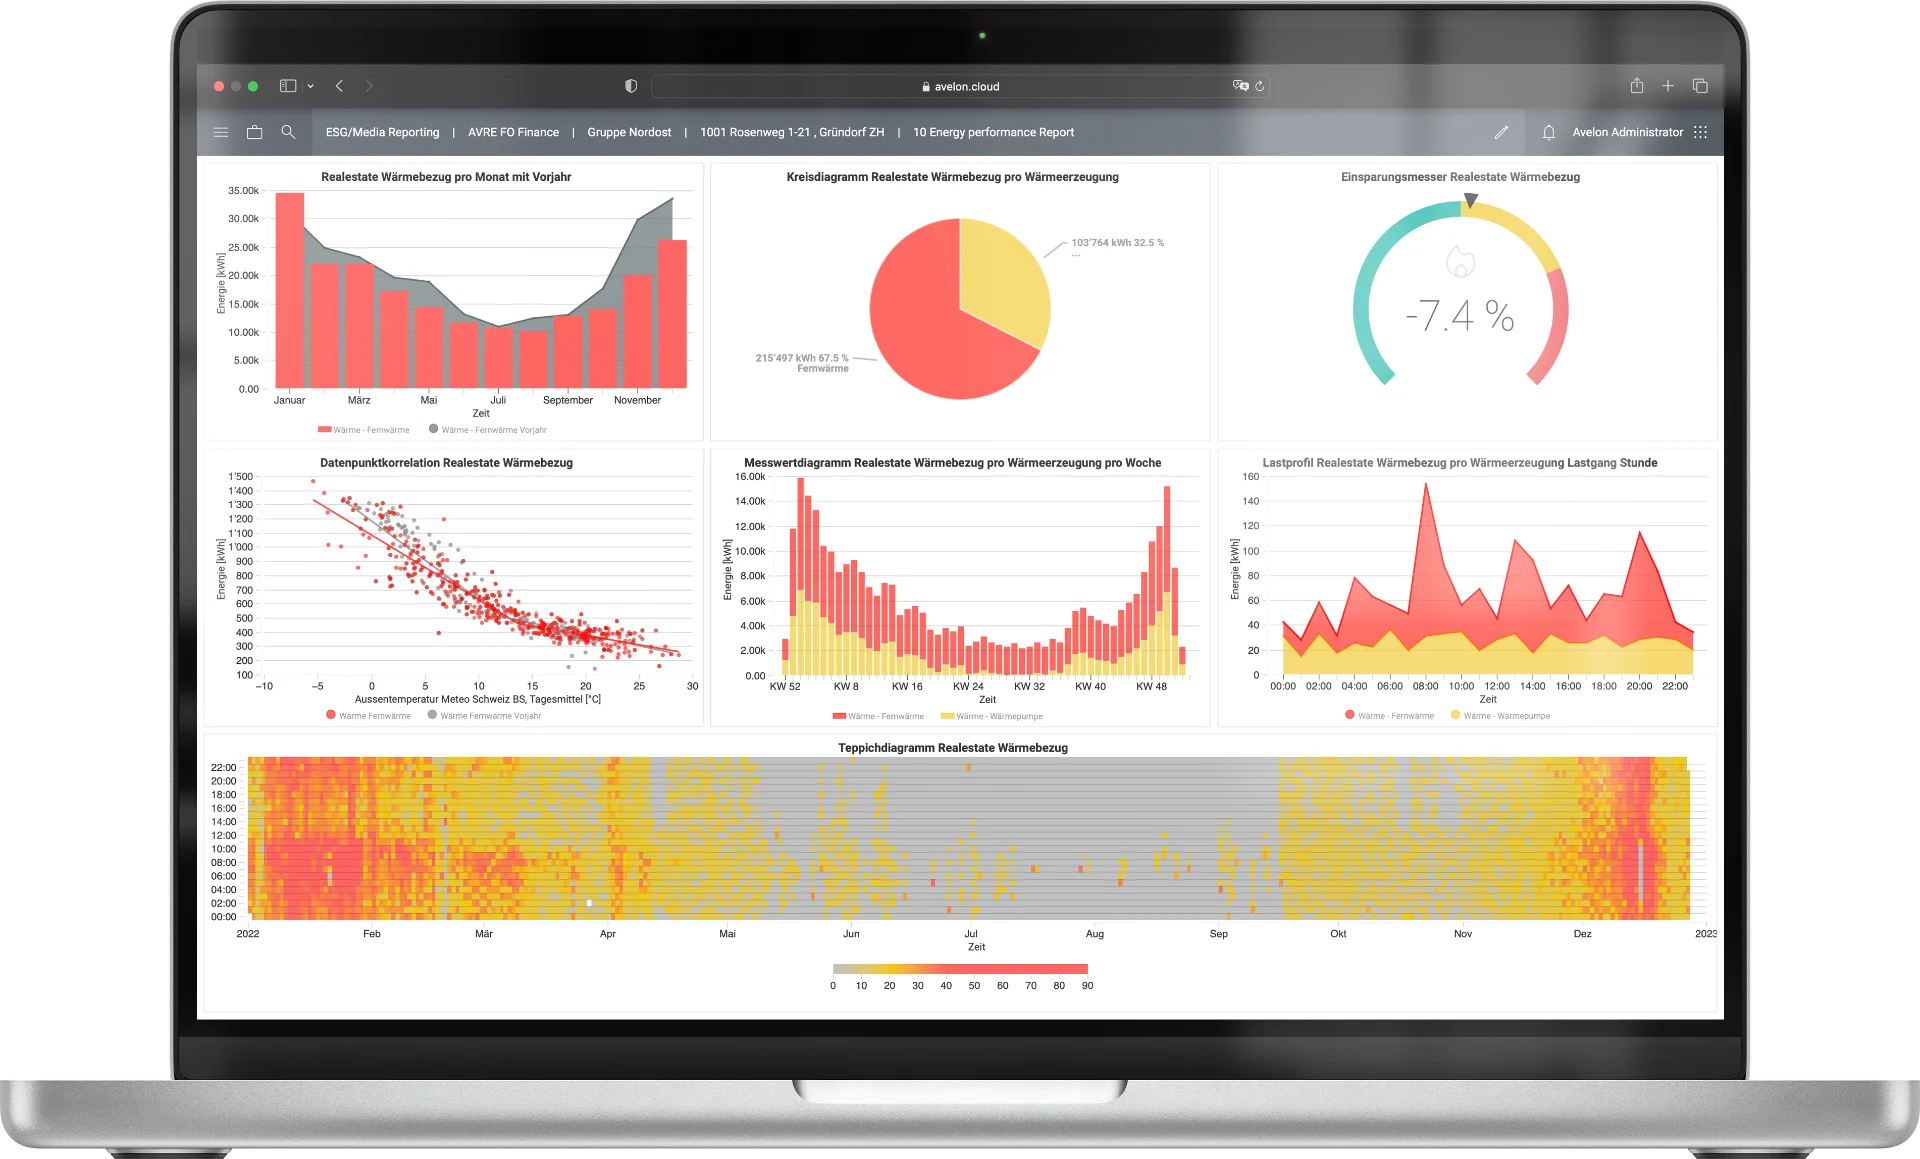
Avelon Energy Management visualizes energy flows, shows losses, calculates consumption and checks the plausibility of measured values. Free dashboards and widgets can be tailored to the individual properties. Your teams and customers will be pleased: For the first time, what was once concealed becomes visible.
KPIs, ISO 50001 and BAFA subsidies
Freely design your KPIs (Key Performance Indices) and have them calculated and visualized live. Certified according to ISO EN DIN 50001 with the possibility of BAFA funding.
Plausibility check
Have measured values checked for plausibility using empirical values. Avelon Energy Management alerts you in case of moderate or large deviations.
Behavioral analysis
Buildings Cybernetics calculates a mathematical model from the building’s behavior and compares this with the current reference. This makes trends visible at an early stage.
Interactive measurement concepts
Digital measurement concepts with meter topologies and measured values, enriched with cost centers and rental areas animate the energy flows in an understandable way.
Well-informed decisions through transparency
Powerful analytics show the current state and behavior of the portfolio in seconds.
Build dashboards according to your needs.
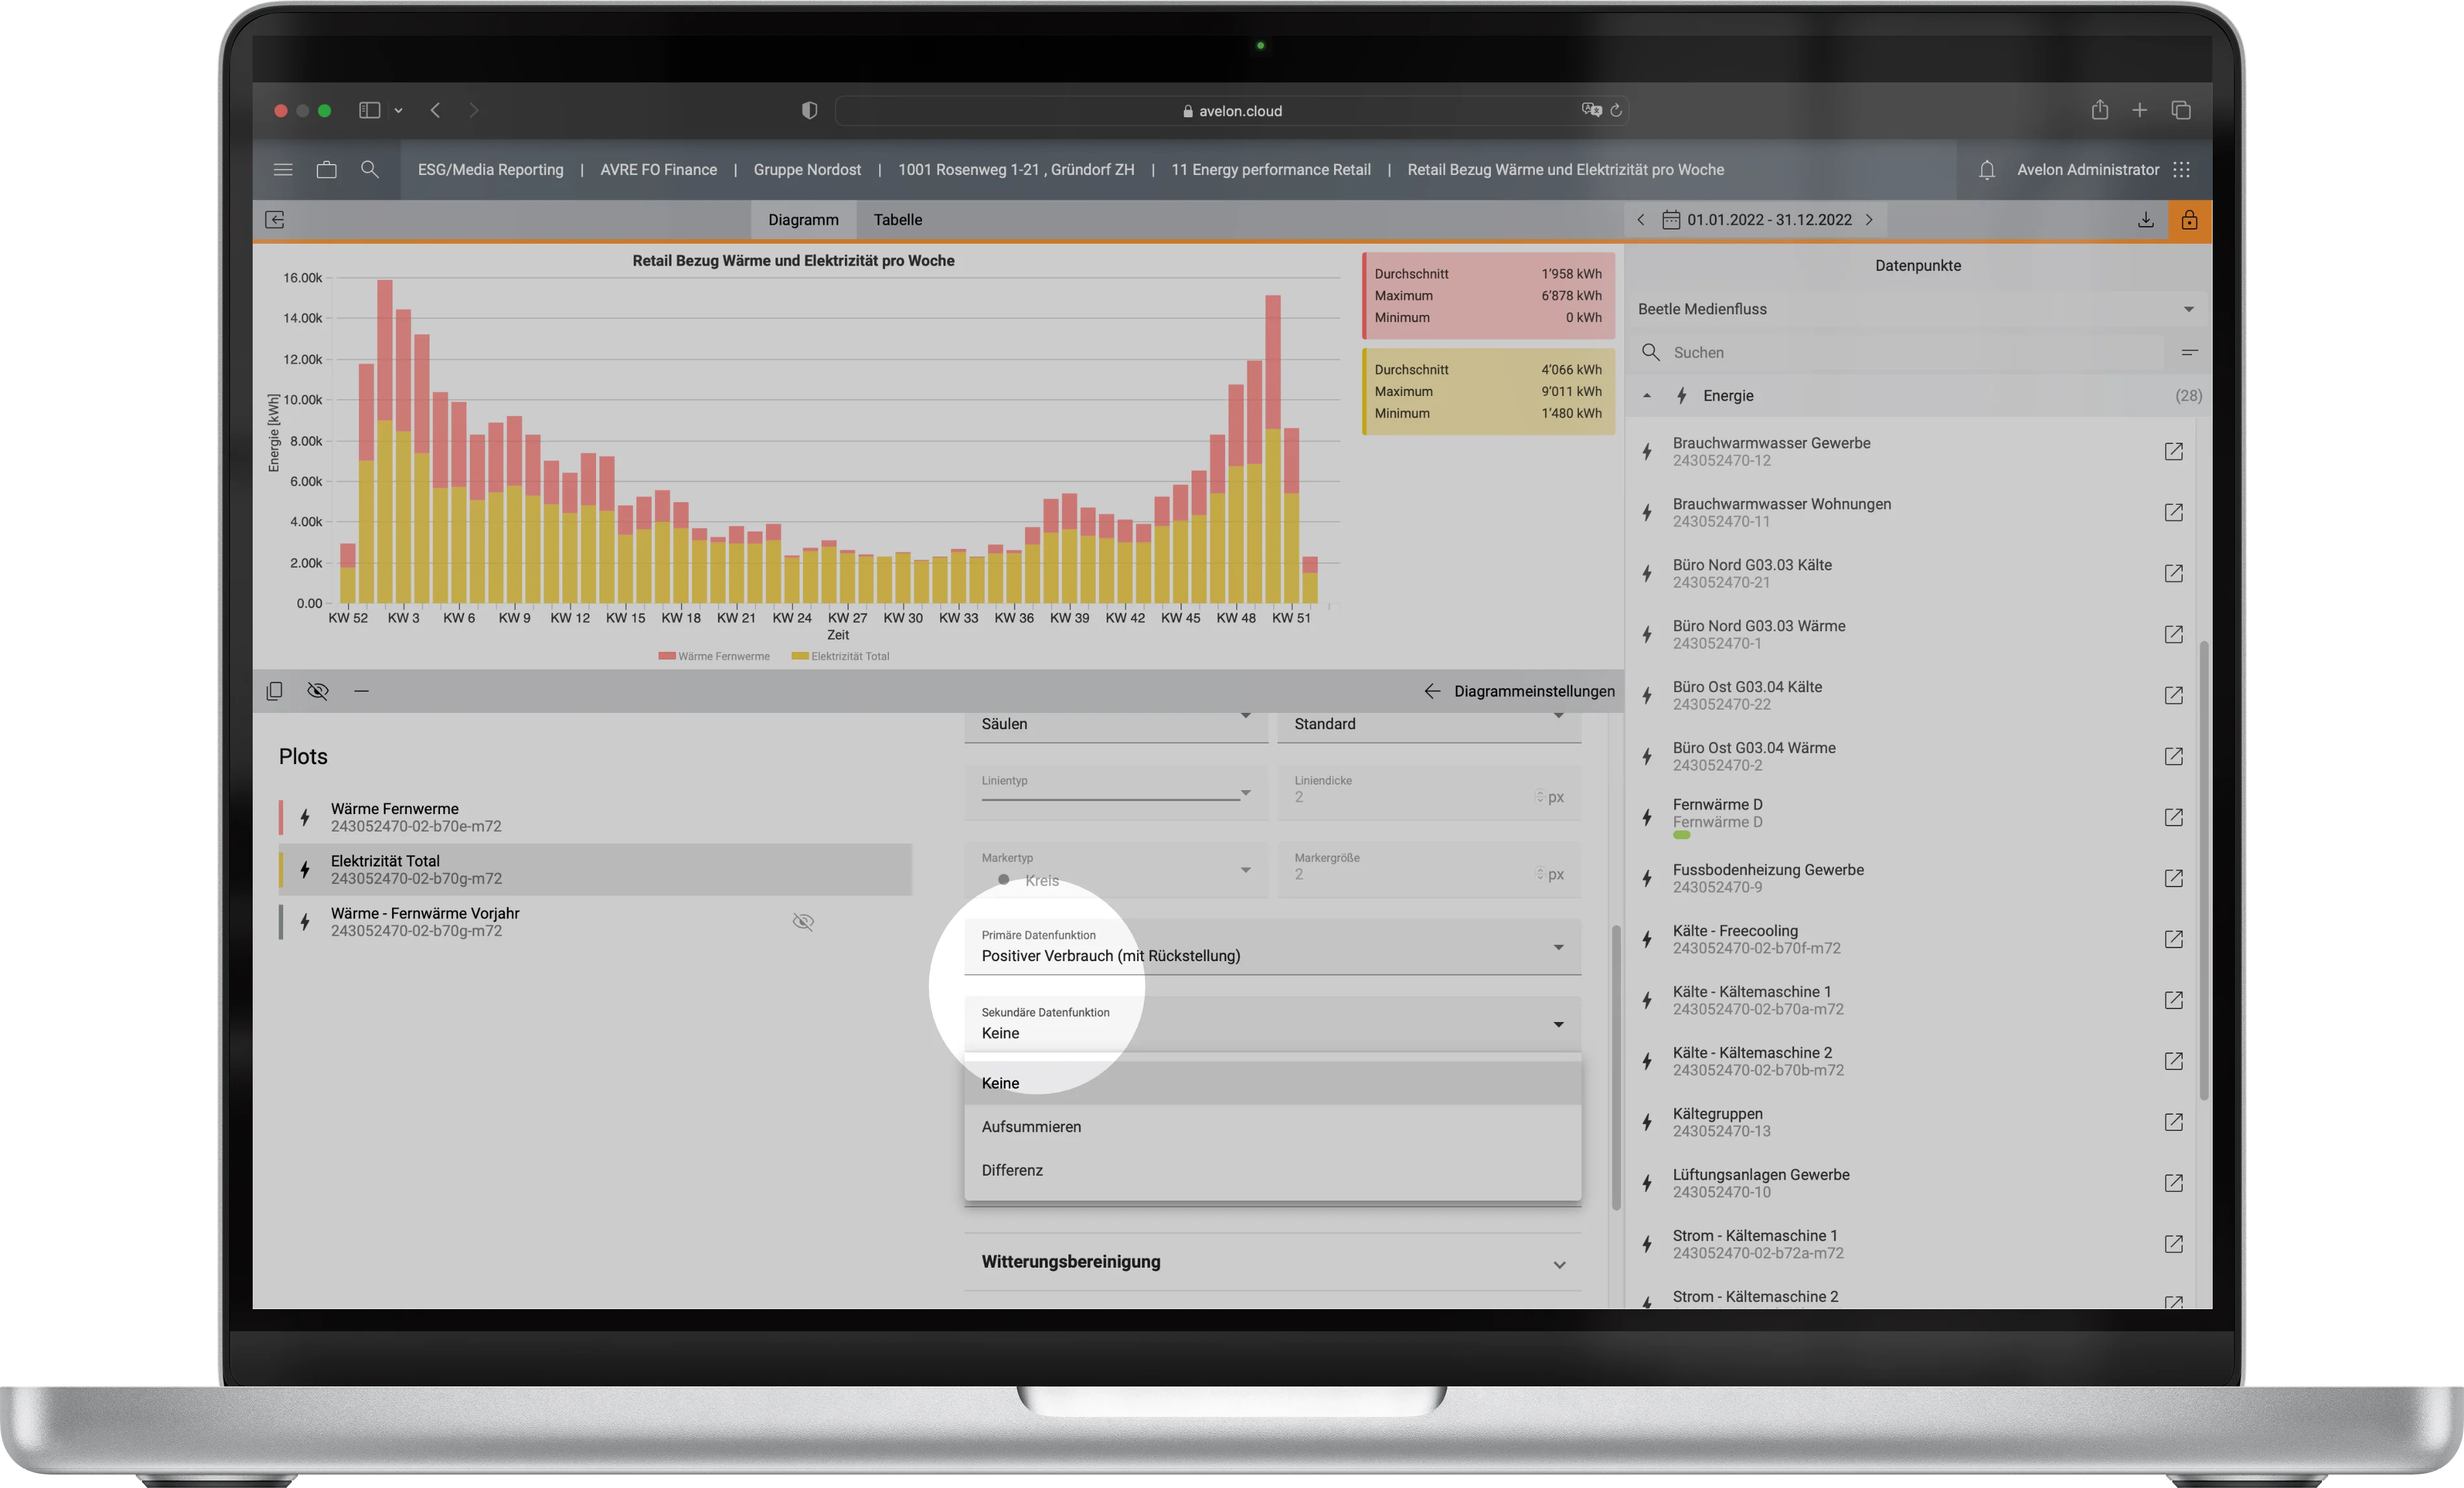
Visual calculations
Calculate the annual consumption or the monthly consumption from the meter readings? Or the daily consumption? Maybe aggregate the values and relate them to the comparison period?
For all those for whom it may also be more demanding.
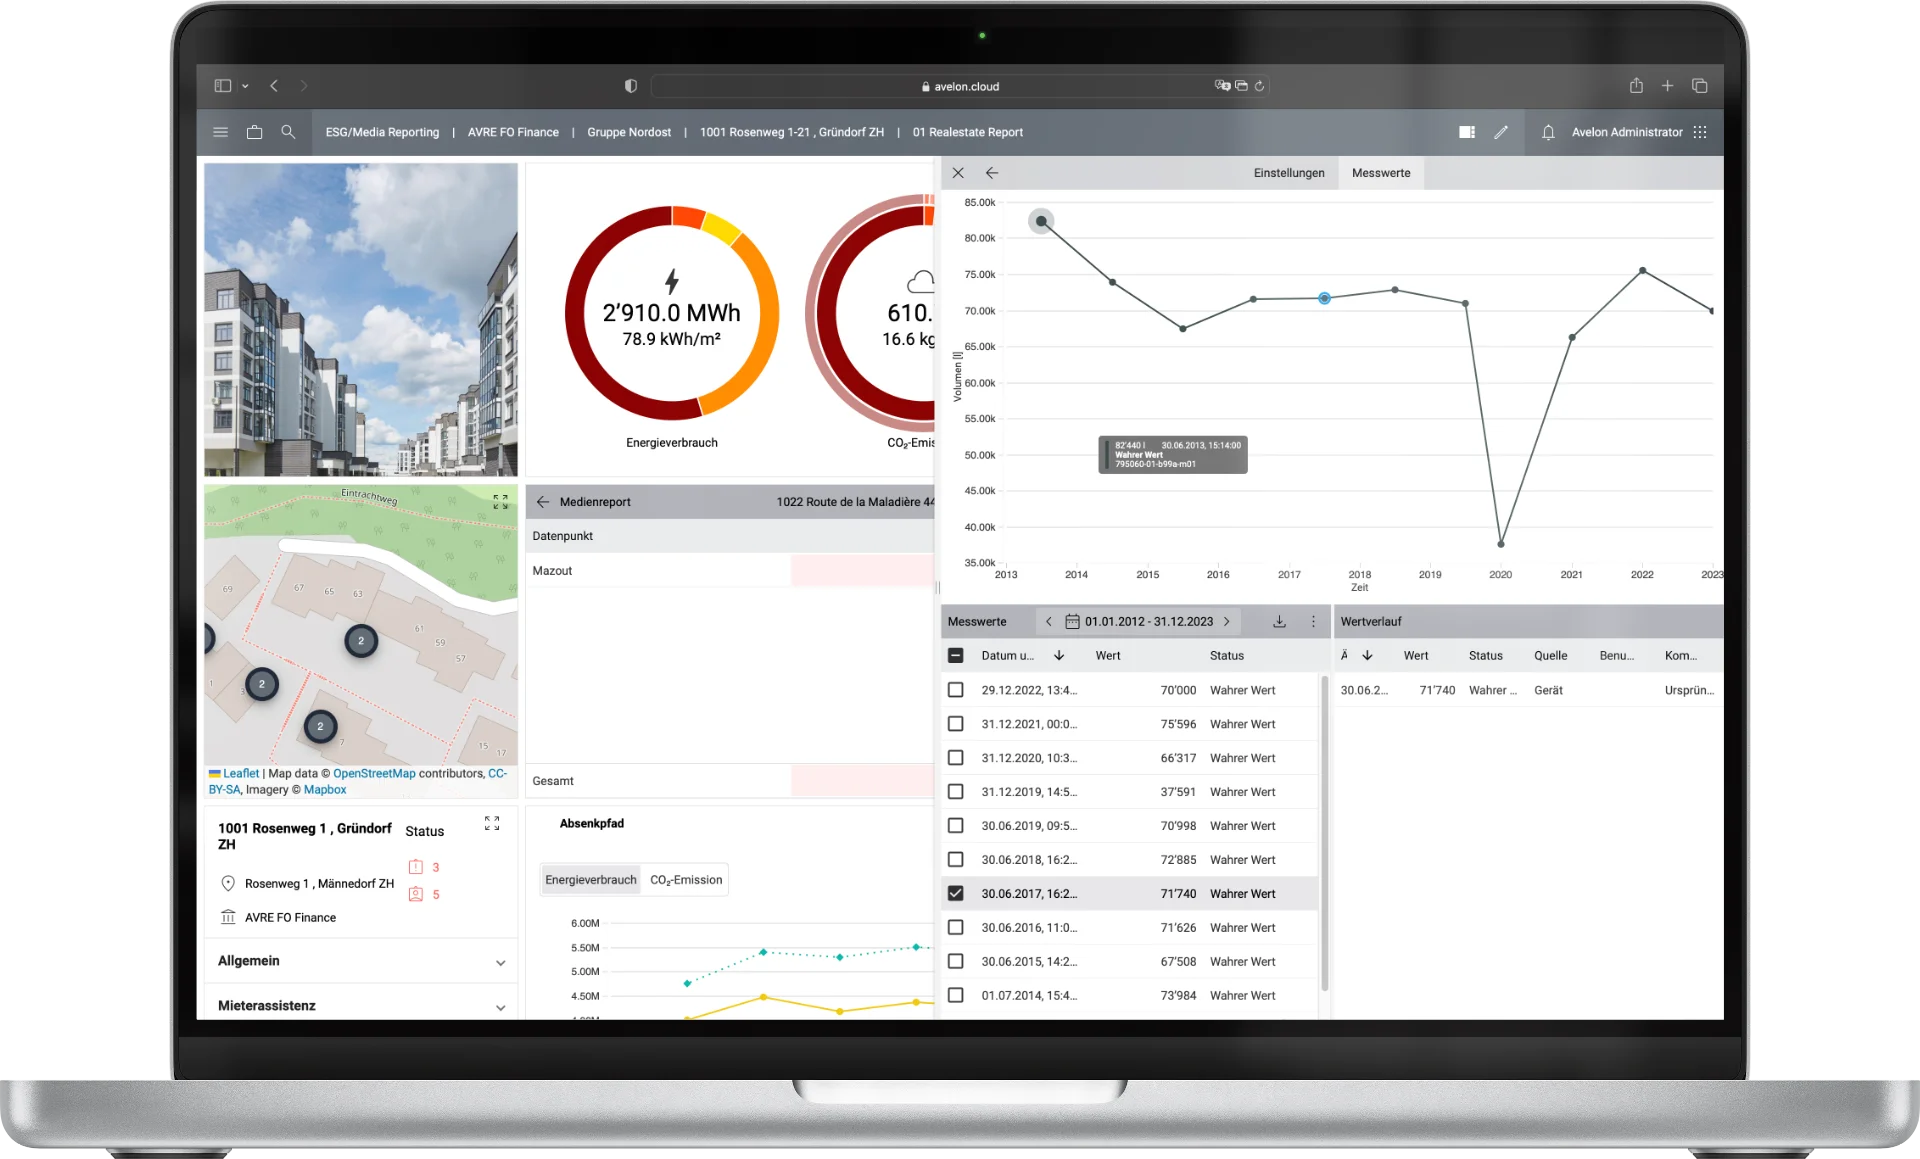
Audit trails
Nothing is easier than the Avelon audit trail: In 2 clicks you get all relevant information about a data point, its value and recording time.
Avelon follows the DIN EN ISO50001 and the M-CH of the electricity industry.
Plausibility check and error correction
From the empirical values of the past, Avelon creates a consumption profile, which it compares with the current consumption. Thus, the plausibility check becomes meaningful.
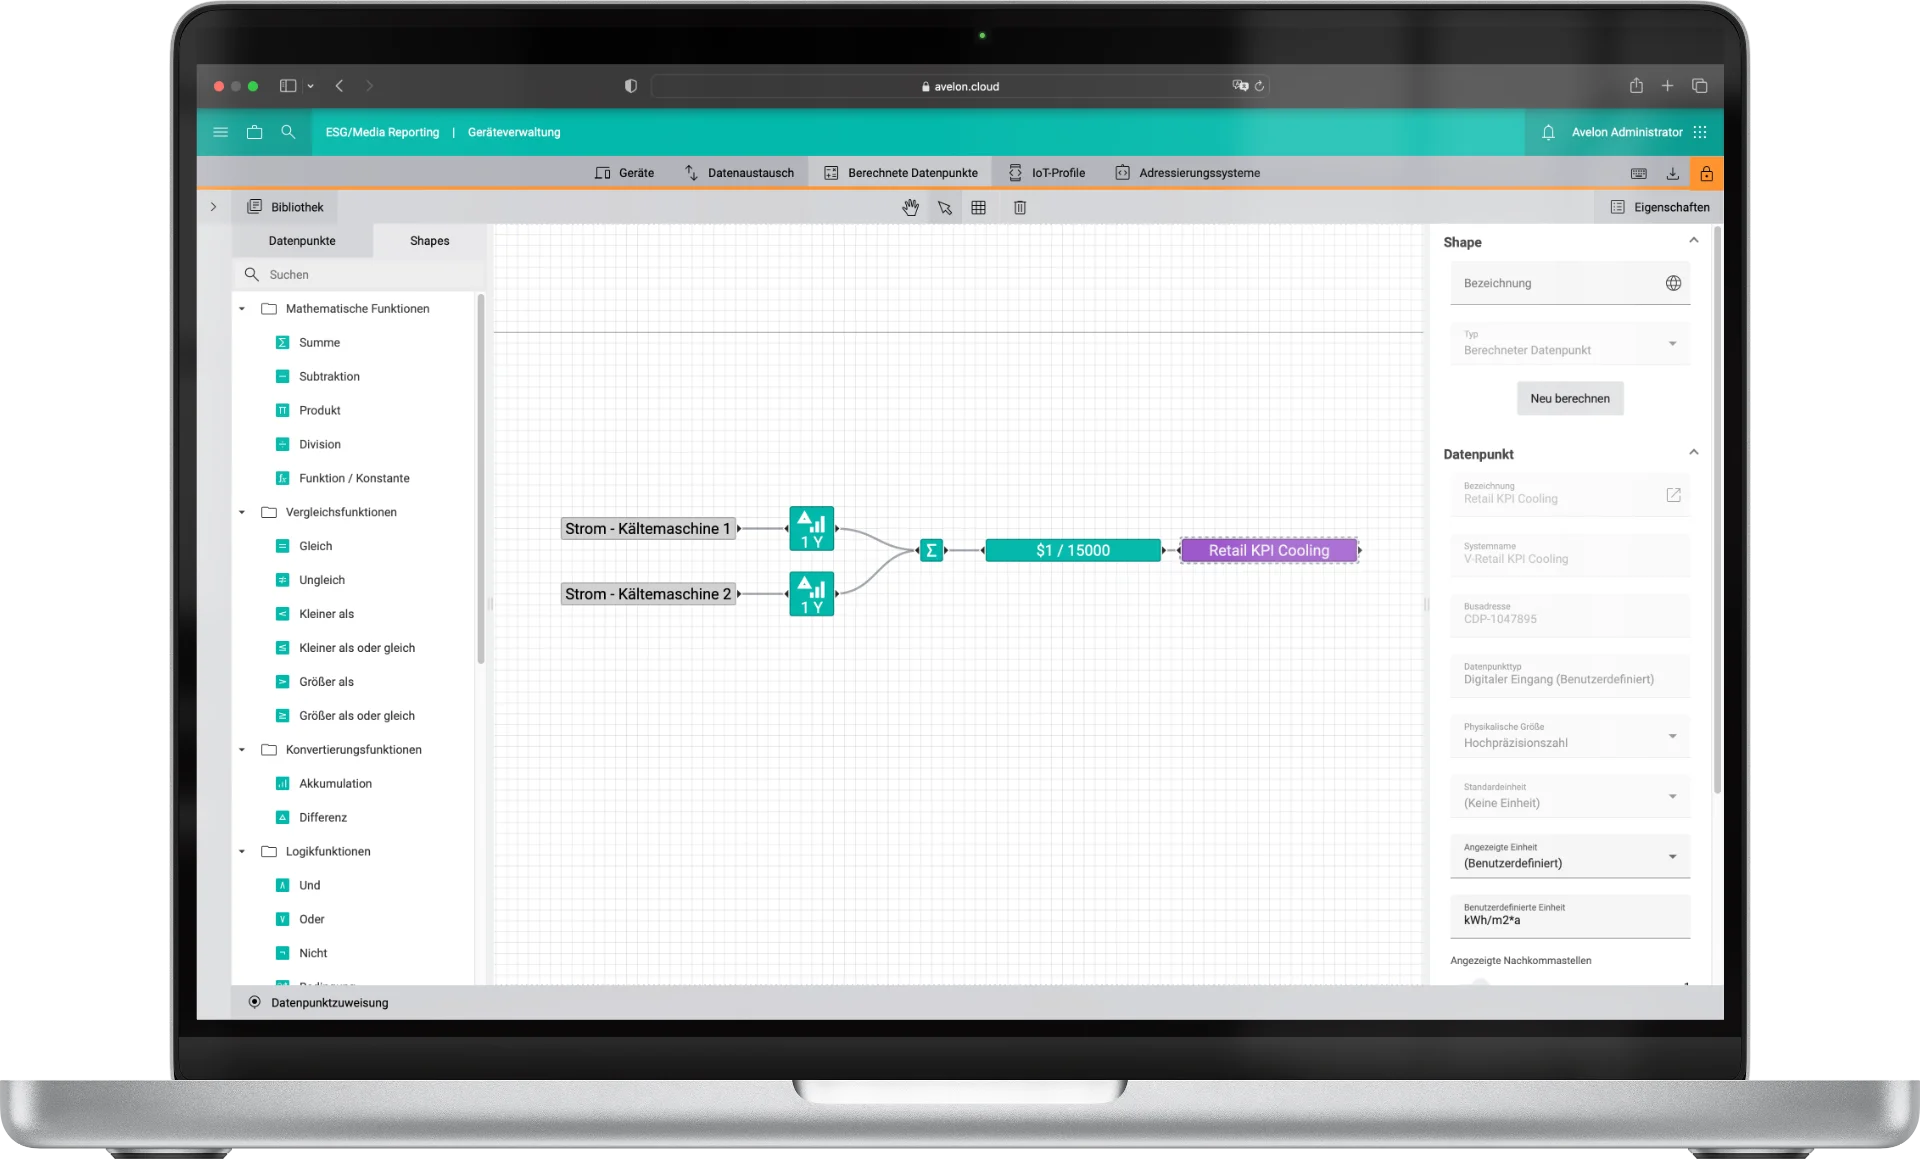
Calculations can be so simple
Quickly calculate the key performance indicators (KPIs)?And this individually tailored to the property? Avelon makes it easy for you: With the graphical editor you create calculations from real data points, functions and virtual data points.
In a few clicks you calculate a bundle of key figures.
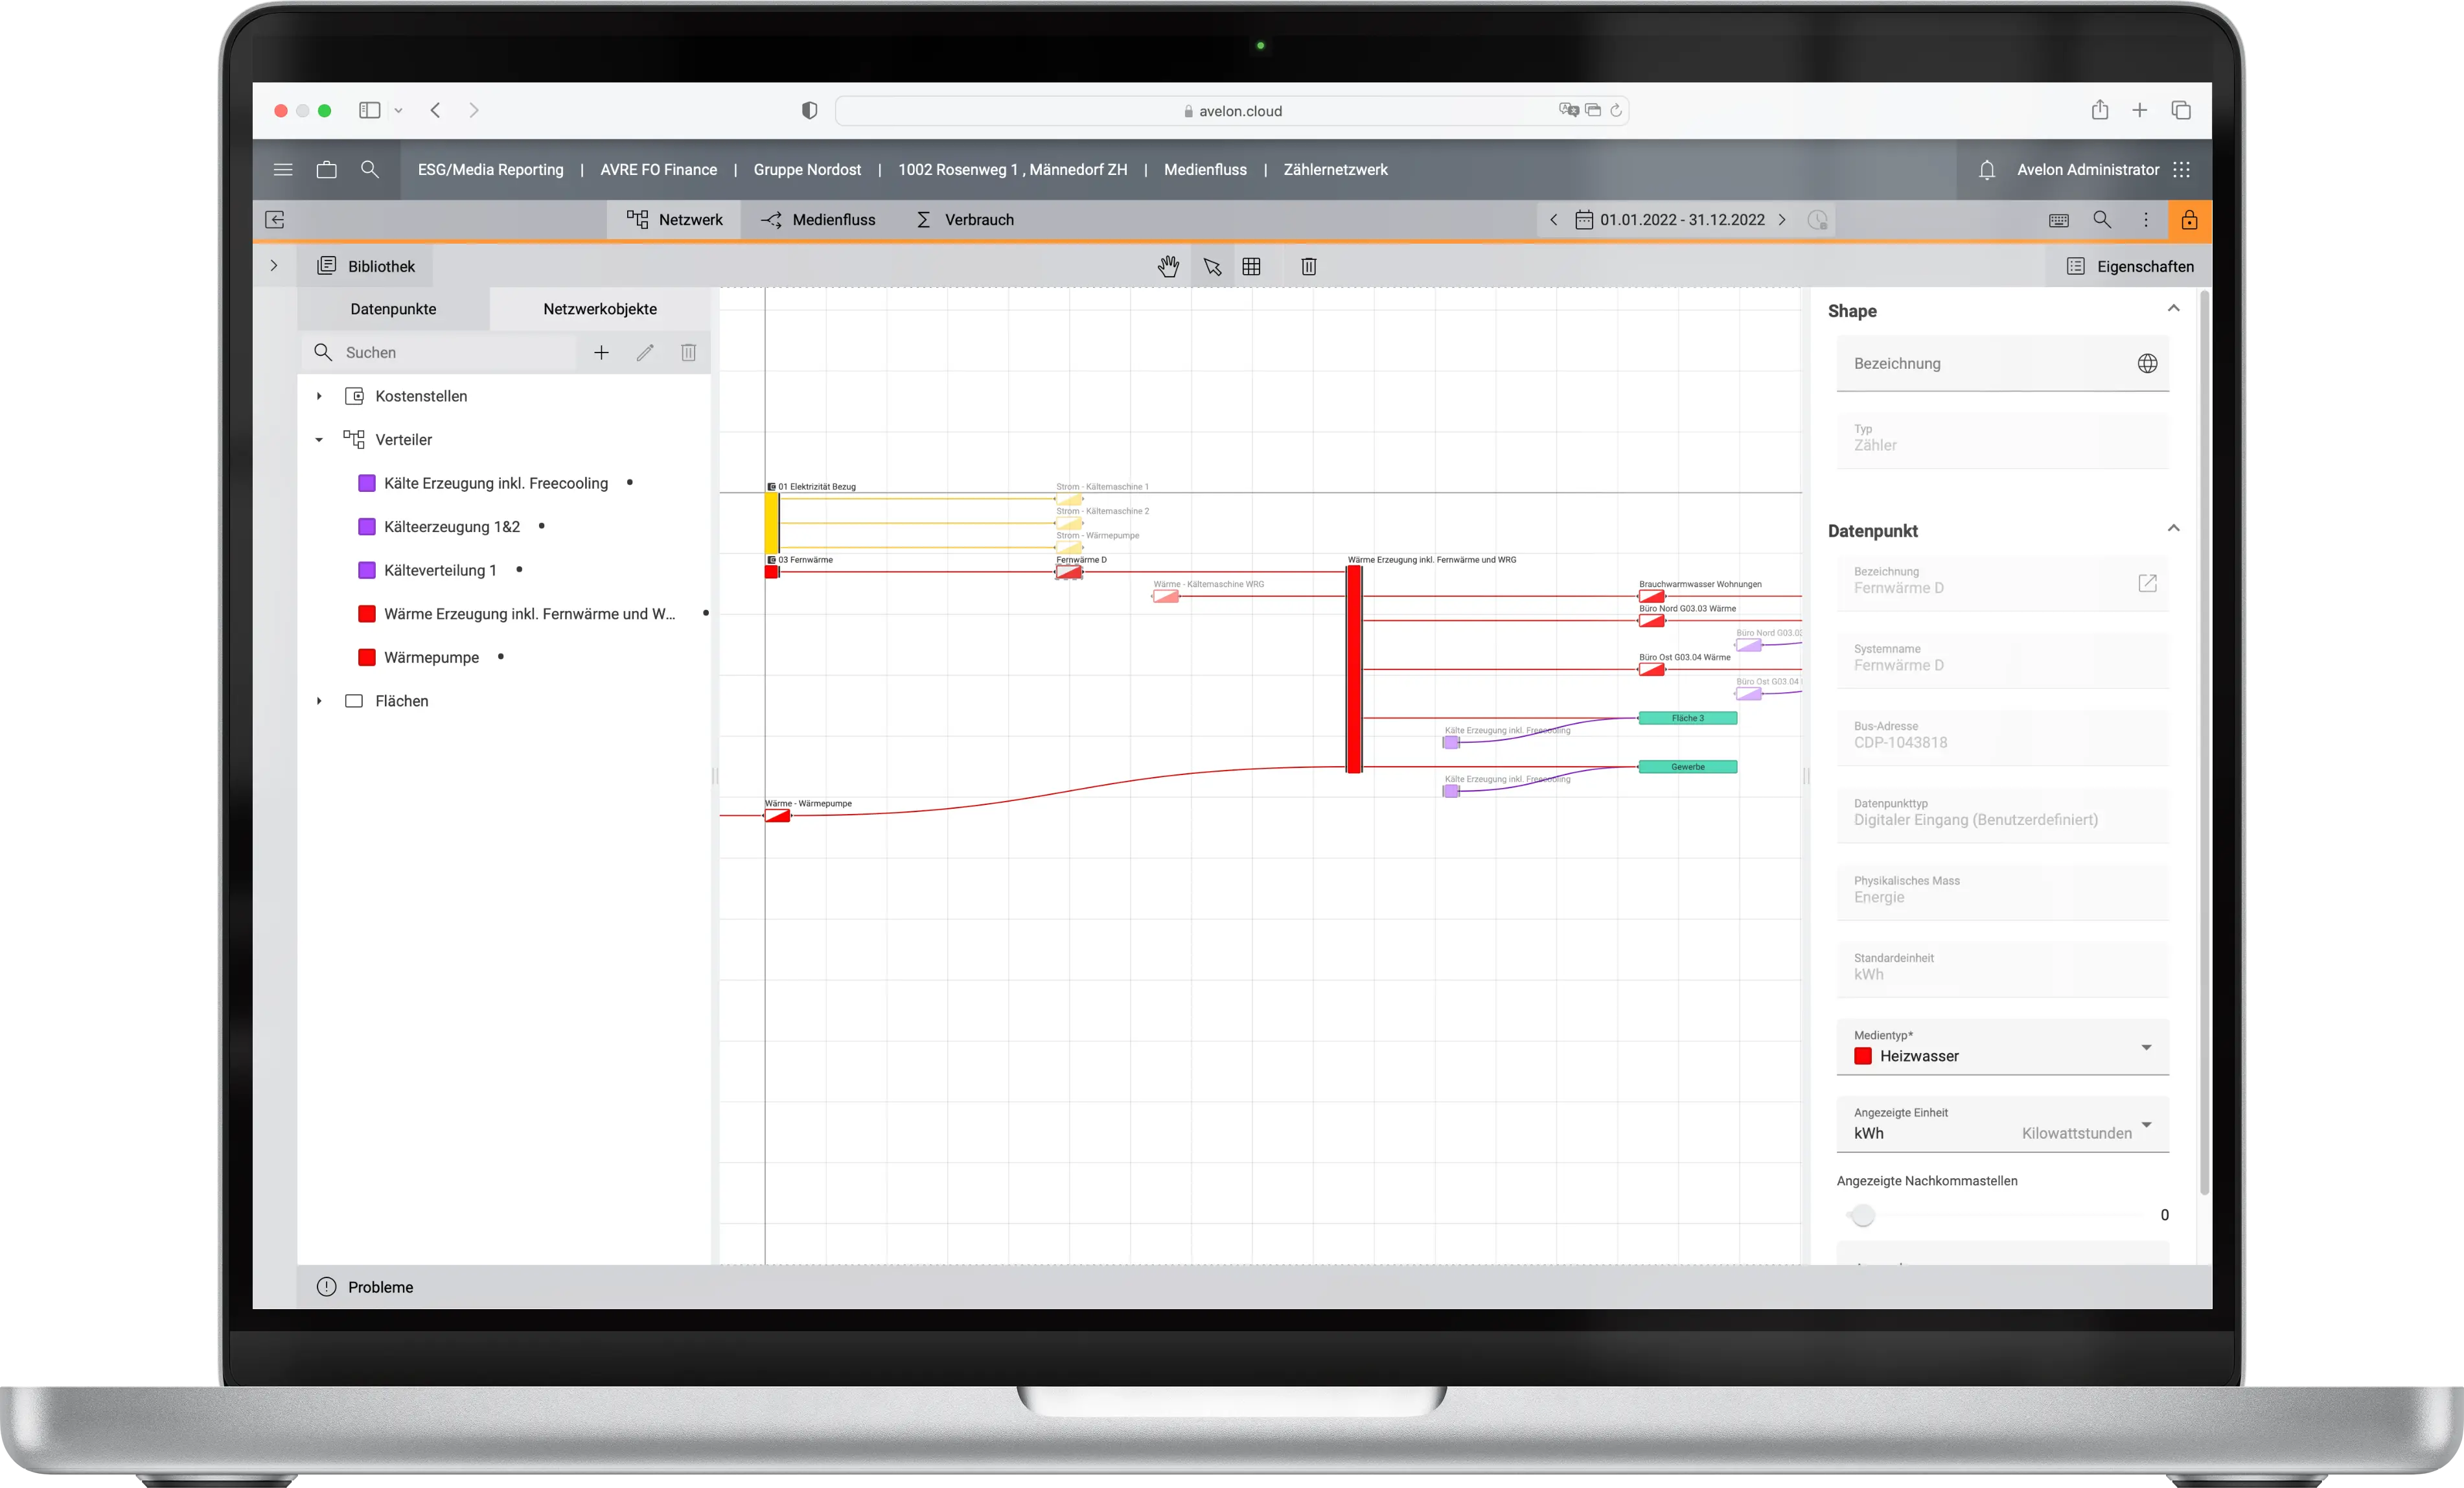
From the measurement concept to media flows and analysis
More to the point: Flow charts say more than a thousand words.
Avelon Energy Management sets the benchmark in energy management.
Draw your metering concepts in the browser, add main feeds and consumers. Avelon does the rest: Media flows are created from your metering concepts.
Avelon reports to you when it finds losses or faulty measurements and takes media conversions into account.
Take all media into account
Take all media into account, including water, gases and special media types.
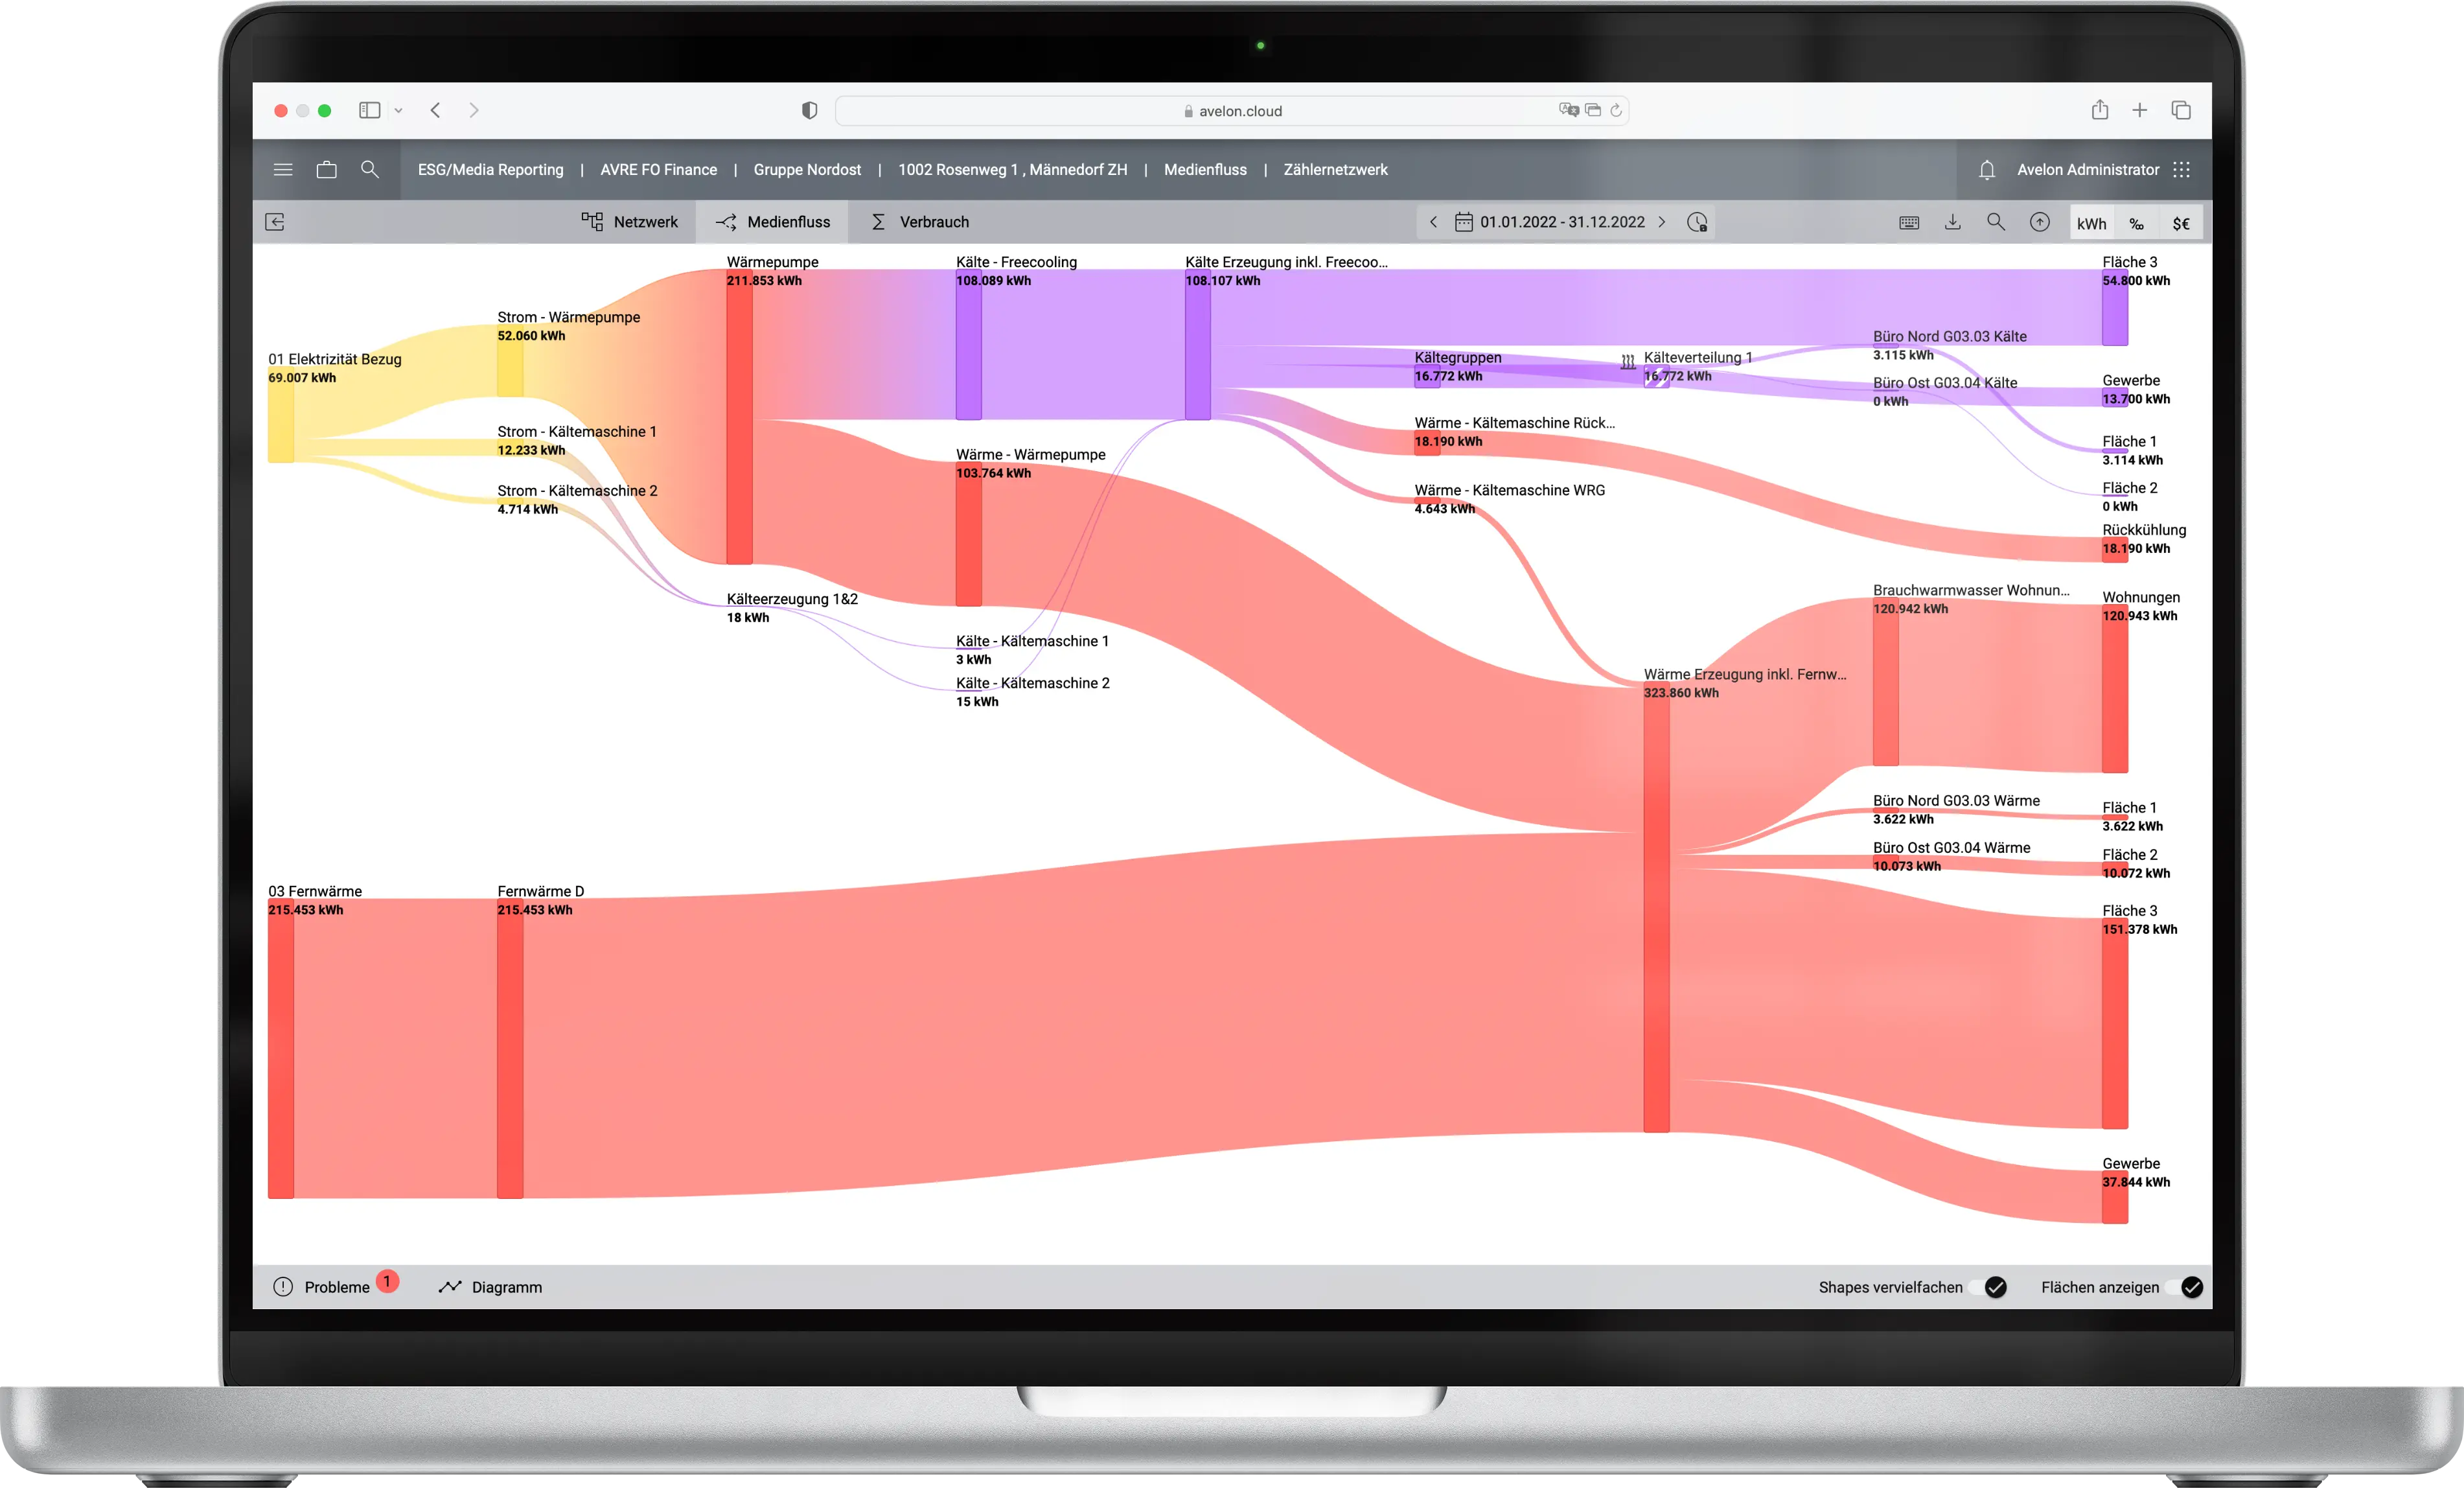
Dynamic networks
Avelon creates dynamic networks for you, from source to destination.
Media flow and media transformations
Avelon makes the energy and media flows visible. Media conversions, e.g. from electricity to heat and cold, are shown transparently by the system.
Loss and problem analysis
Avelon analyzes media flows for losses and perpetual energy generation, i.e. incorrect measurements. Error reports inform about tasks to be solved.
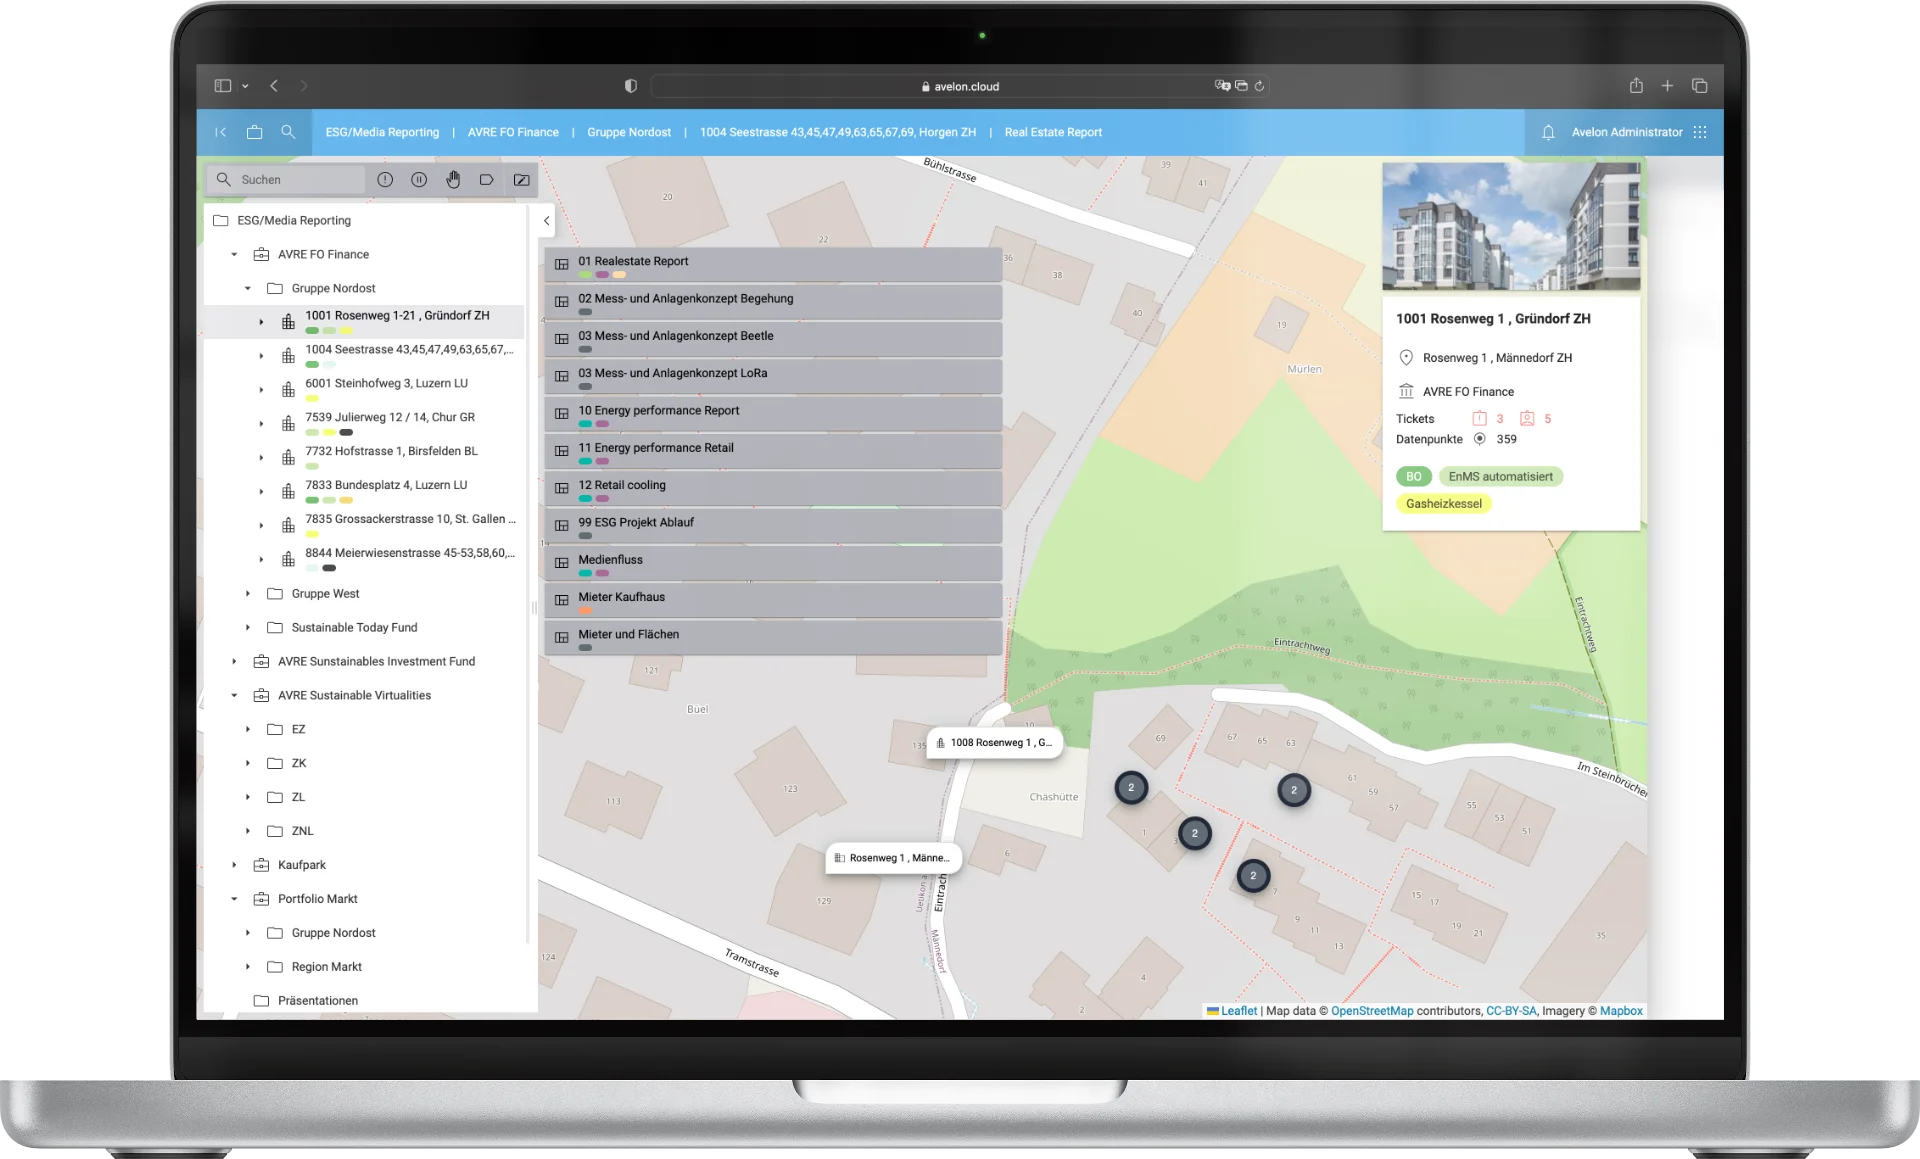
All locations at a glance
For portfolios and retail: with Avelon all locations are clearly at hand
Avelon Energy Management provides an overview even in large portfolios.
Find out which measures are still pending and what has been completed.Assign any indicators to your properties and filter them accordingly. With Avelon you keep the overview.
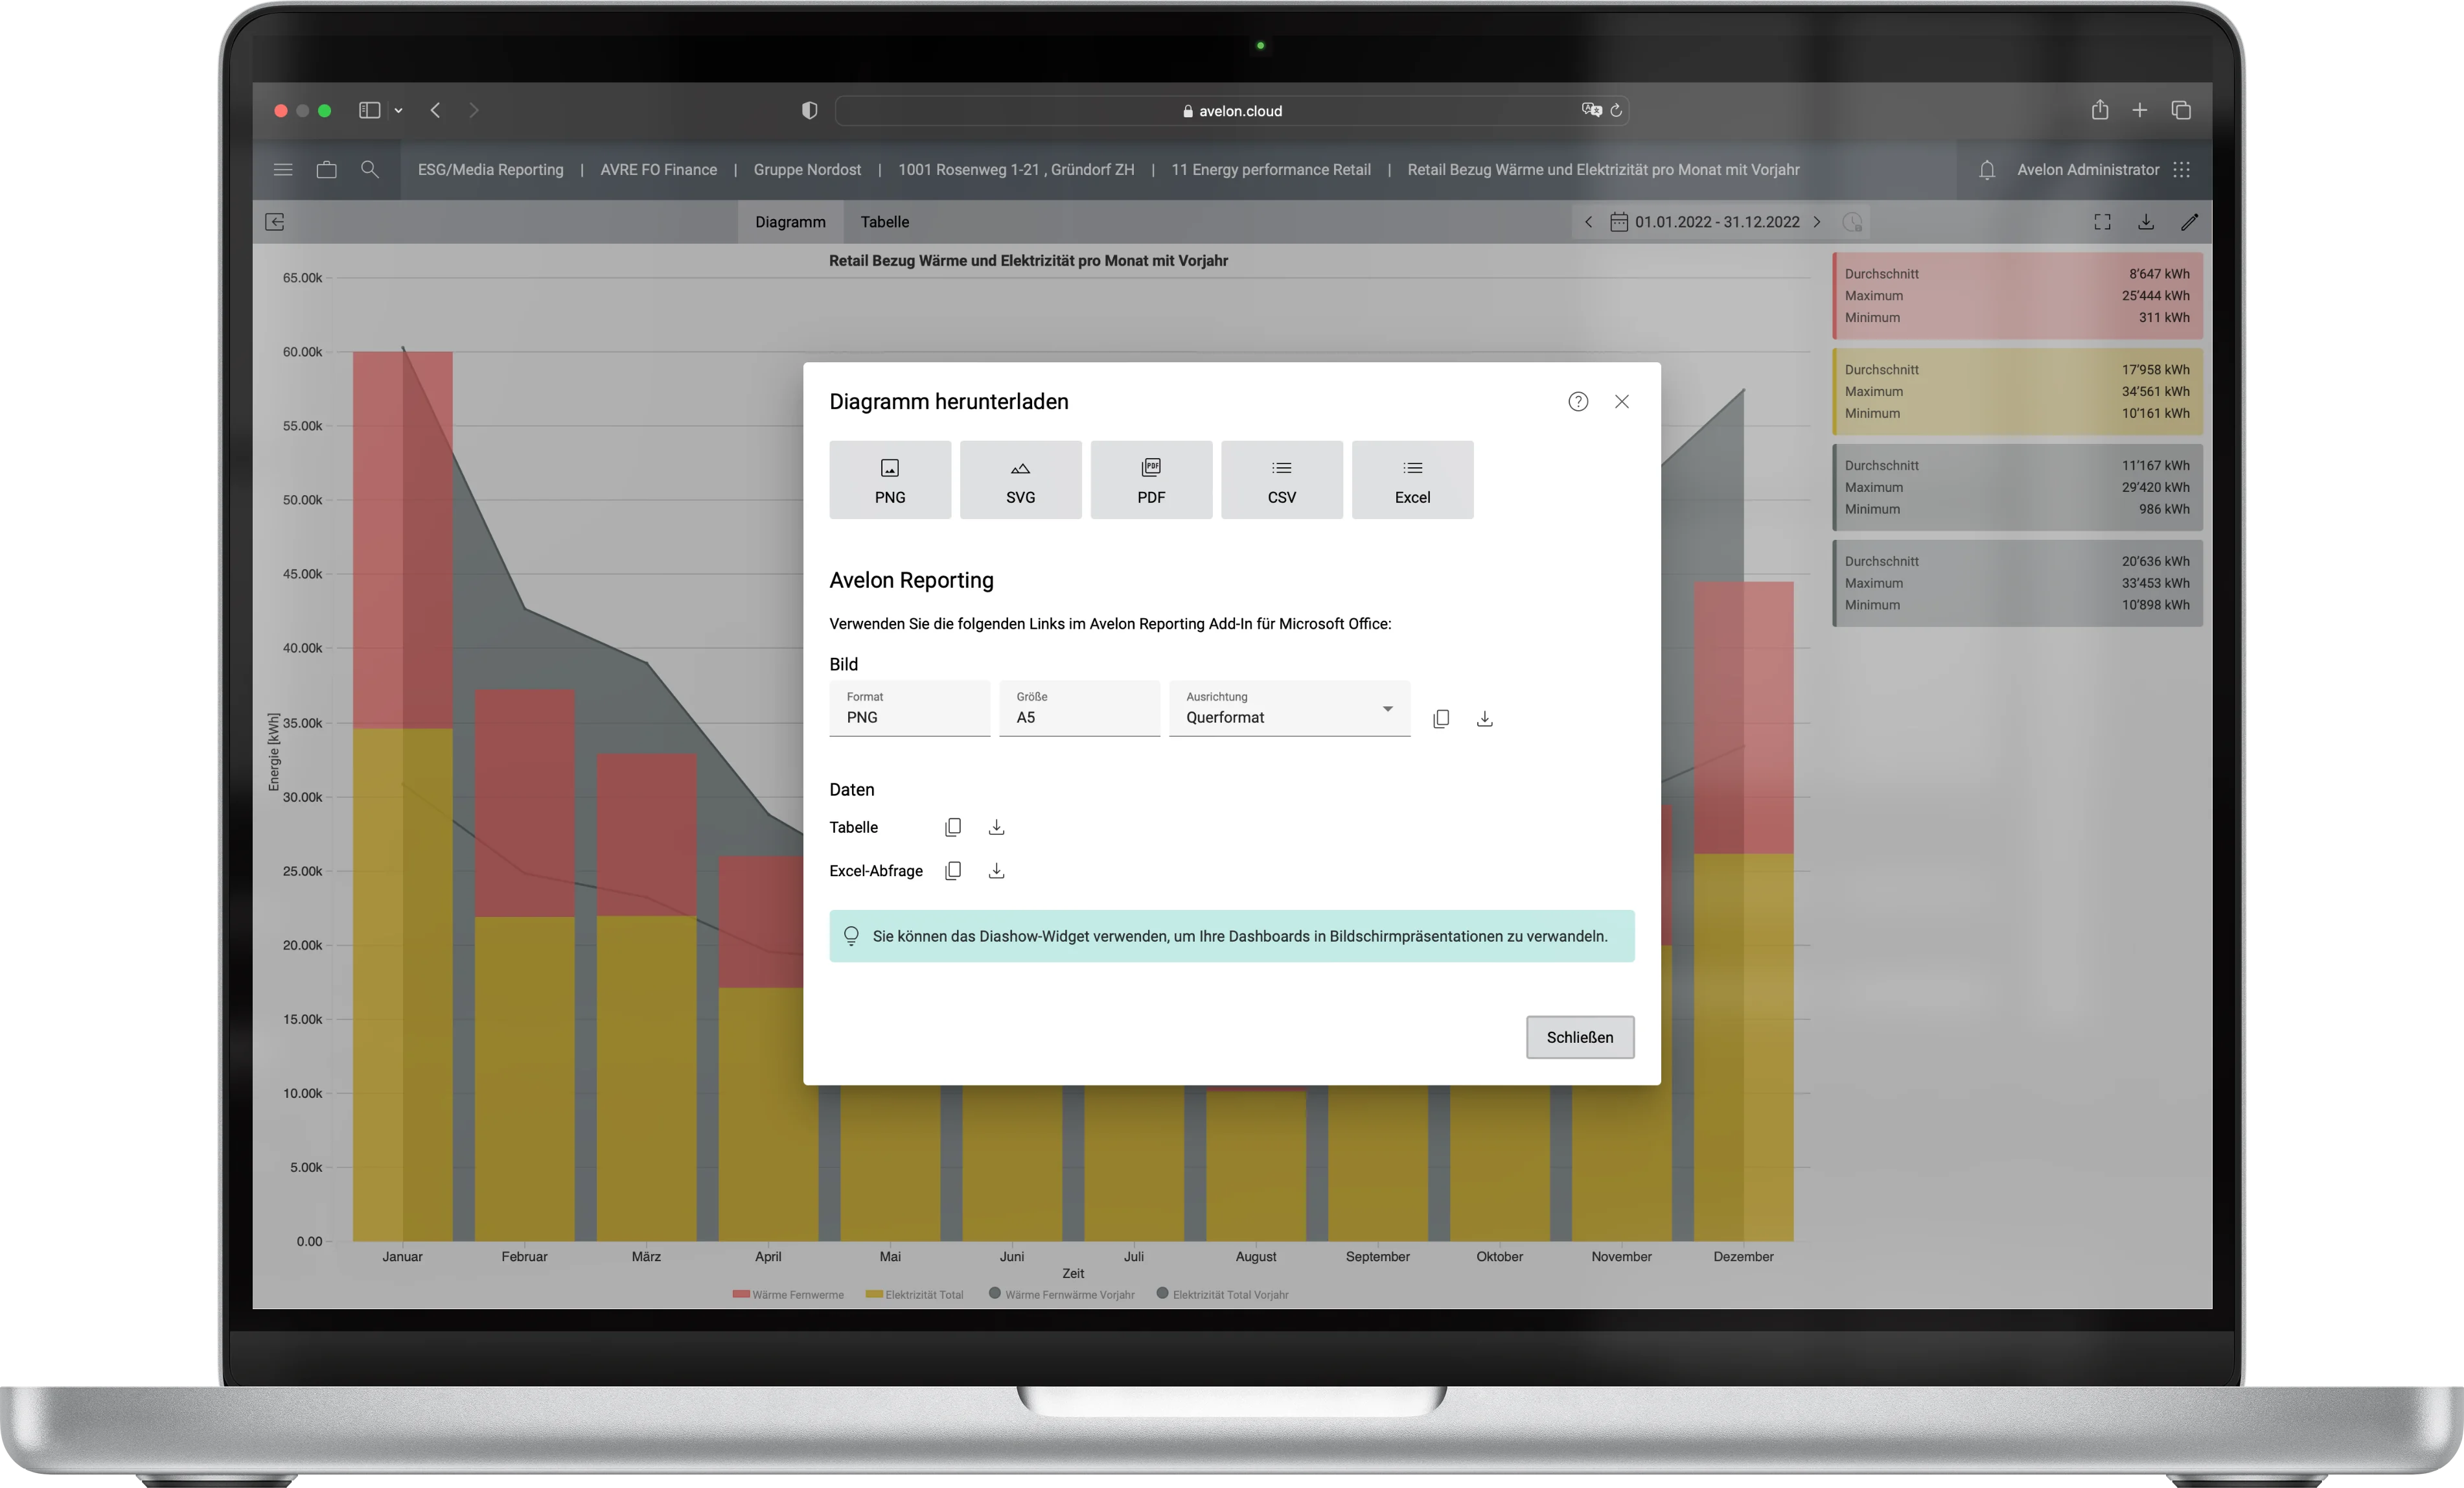
Extensive export options
Data in charts are aggregated and configured.
Avelon provides you with rich options so that you can export your data quickly.
Energy is energy – no matter the unit
Why bother with units like kWh, Wh, J or MWh? It is all energy, anyway.
Avelon does the conversion for you. If you want to combine measured values with different units, Avelon takes care of the conversions of the different units. Energy remains energy.
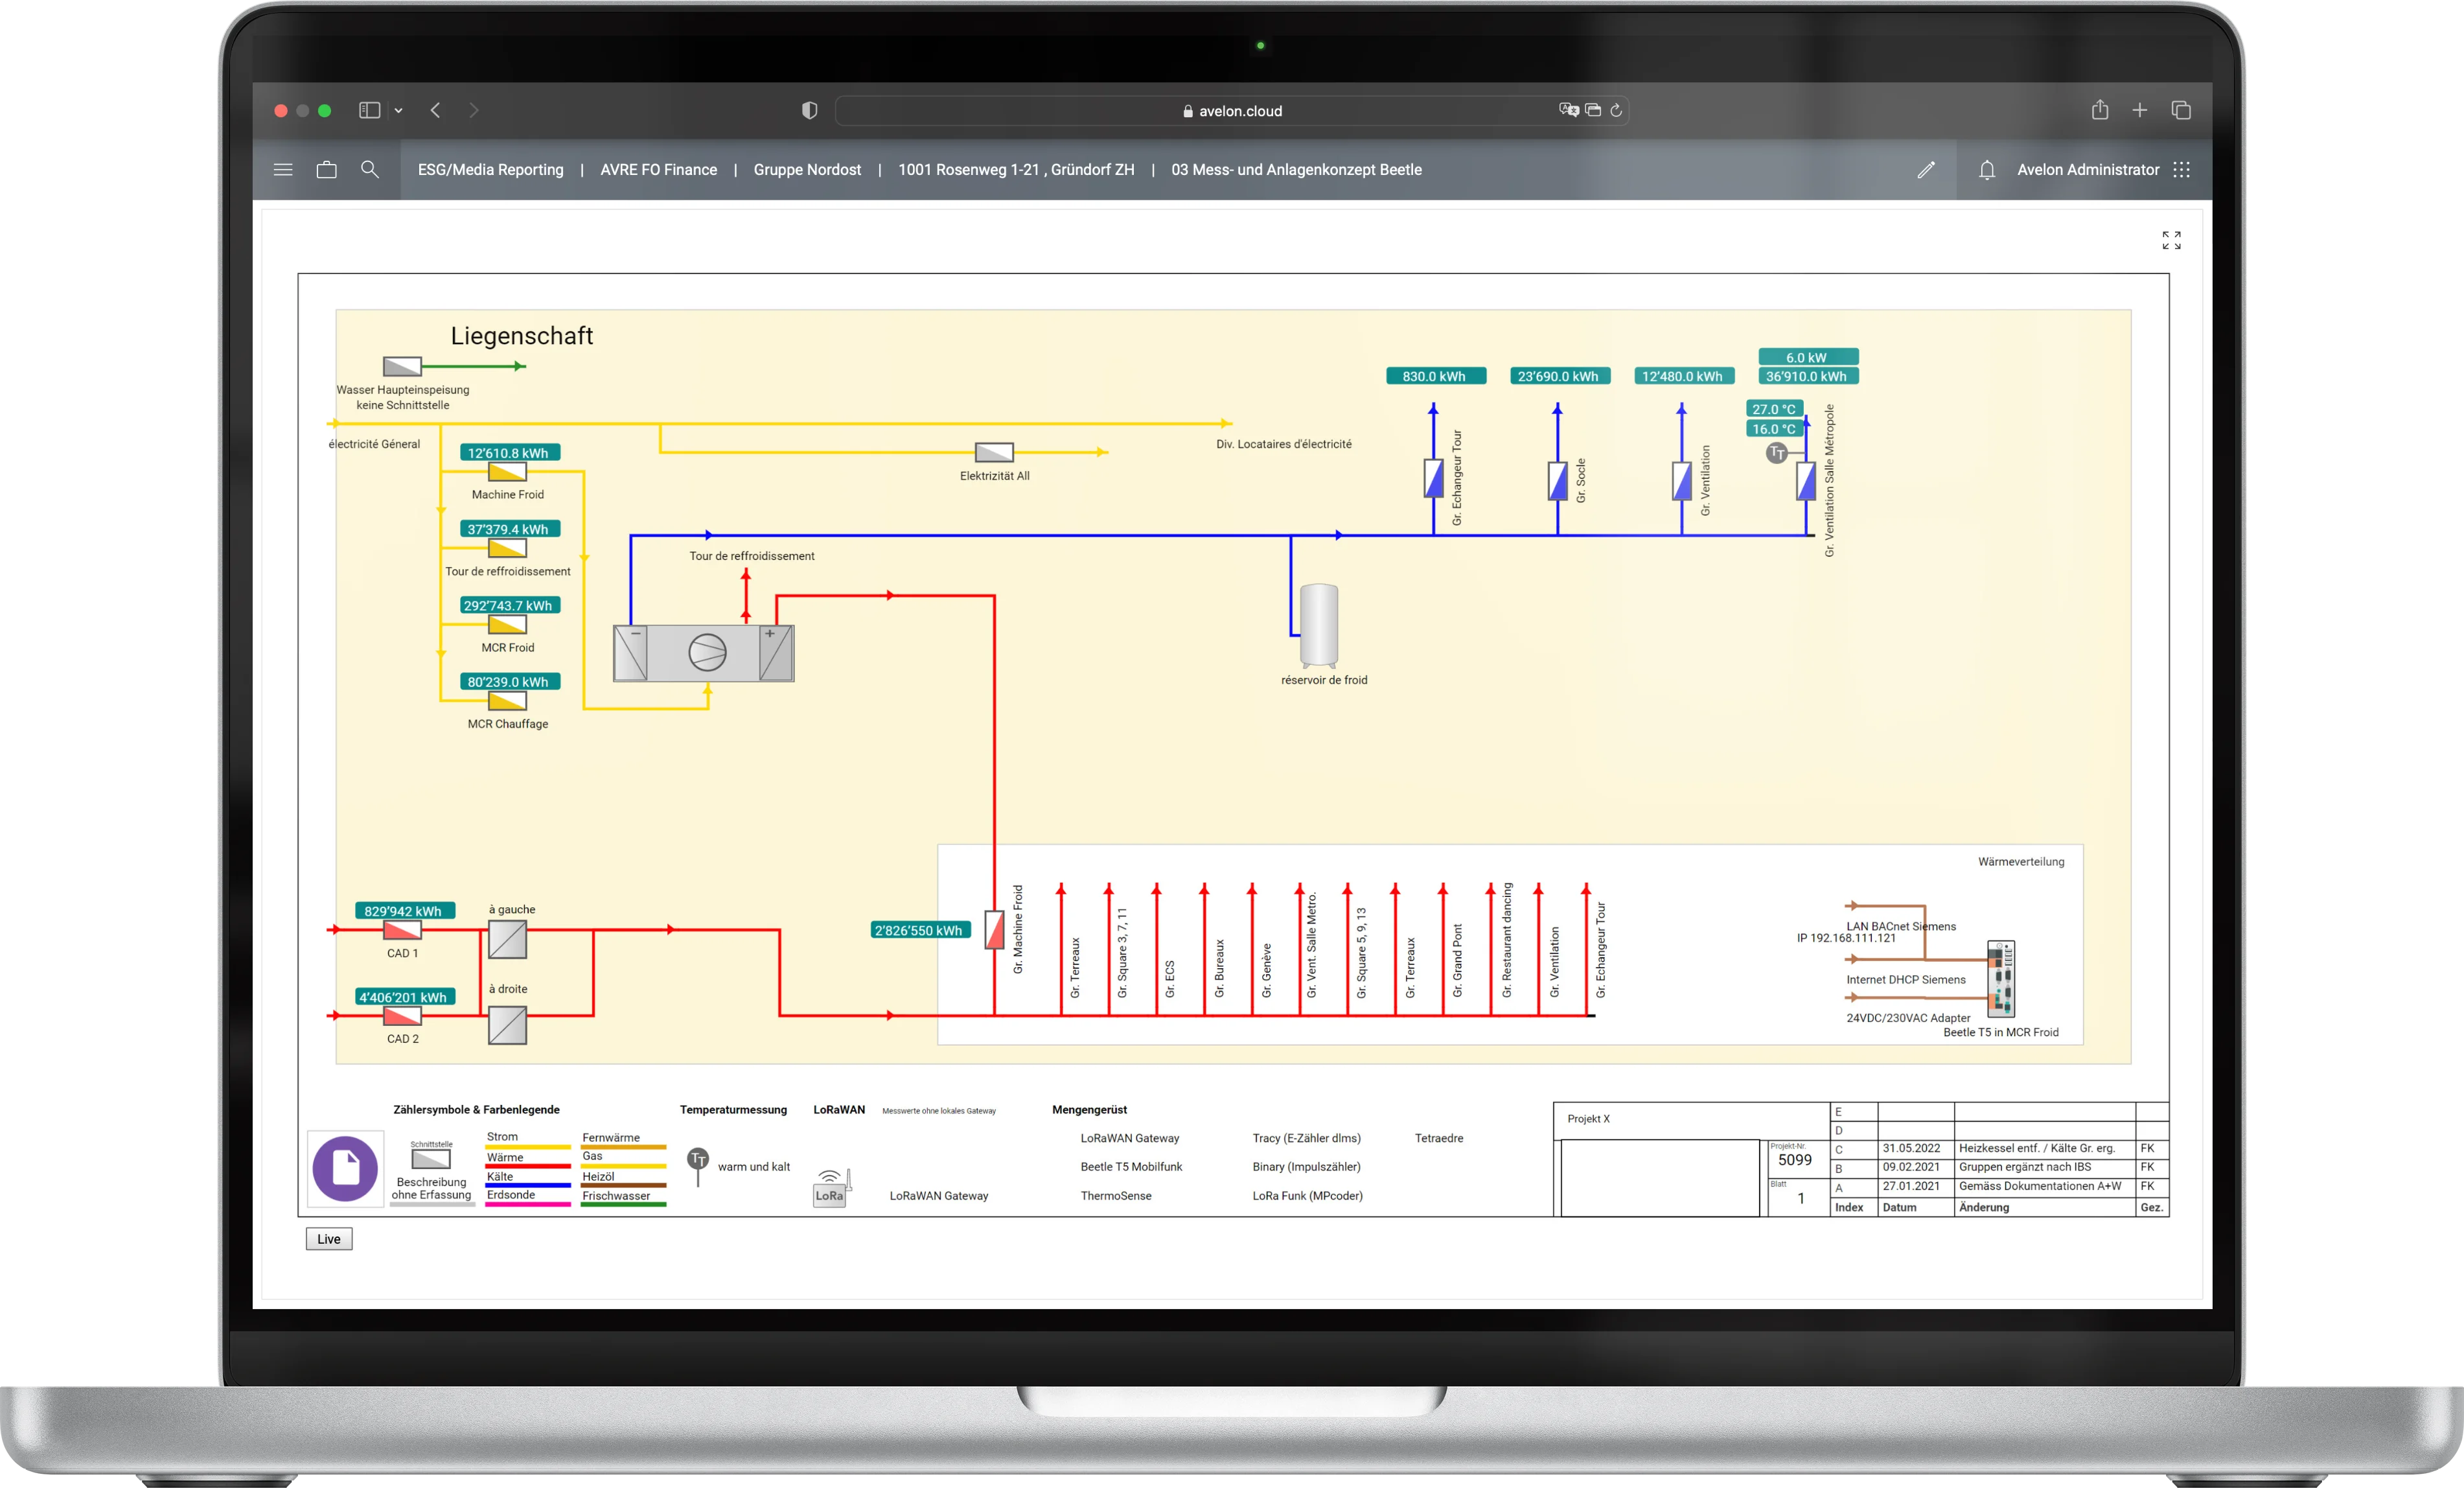
Principle diagrams for operation optimization
With energy management comes operational optimization. Avelon ensures seamless information exchange.
The principle diagrams of the Avelon systems create clarity: media conversions, the networking of the plants and delimitation of buildings and properties support the operation optimizers.
The principle diagram is adjusted online, displays the current meter readings and references.
The schematic diagram is adjusted online and shows the current calendars and references.
Efficiently tap all data sources
The right technical integration for every property.
With a range of operational and technical options, Avelon makes data collection efficient and focused.
The weighting of a property or location determines the technical integration – not the other way around.
Invoice entry
With the simplest data entry by reading in municipal utility bills, Avelon ESG/M checks the plausibility online.
Manual readings also with QR code
Manual readings via app (with the option to scan a QR code) optimize the recording and check the plausibility also offline.
Digital interface to municipal utilities
Avelon ESG/M reads in meter values via server direct connections to the municipal utilities. This is a cost-optimized variant.
Reliable with LPN radio networks
Private measurements and on-site measurements are recorded by Avelon ESG/M via LPN radio networks or use of conventional protocols.